Data
| Country | 2025 Pop. | 2024 Pop. | |||
|---|---|---|---|---|---|
| 1 | Tokyo | Japan | 37,036,200 | 37,115,000 | -0.21% |
| 2 | Delhi | India | 34,665,600 | 33,807,400 | 2.54% |
| 3 | Shanghai | China | 30,482,100 | 29,867,900 | 2.06% |
| 4 | Dhaka | Bangladesh | 24,652,900 | 23,935,700 | 3% |
| 5 | Cairo | Egypt | 23,074,200 | 22,623,900 | 1.99% |
| 6 | Sao Paulo | Brazil | 22,990,000 | 22,806,700 | 0.8% |
| 7 | Mexico City | Mexico | 22,752,400 | 22,505,300 | 1.1% |
| 8 | Beijing | China | 22,596,500 | 22,189,100 | 1.84% |
| 9 | Mumbai | India | 22,089,000 | 21,673,100 | 1.92% |
| 10 | Osaka | Japan | 18,921,600 | 18,967,500 | -0.24% |
| 11 | Chongqing | China | 18,171,200 | 17,773,900 | 2.23% |
| 12 | Karachi | Pakistan | 18,076,800 | 17,648,600 | 2.43% |
| 13 | Kinshasa | DR Congo | 17,778,500 | 17,032,300 | 4.38% |
| 14 | Lagos | Nigeria | 17,156,400 | 16,536,000 | 3.75% |
| 15 | Istanbul | Turkey | 16,236,700 | 16,047,400 | 1.18% |
Conclusions
Largest Cities by Population (2025). World Population Review.
Analysis
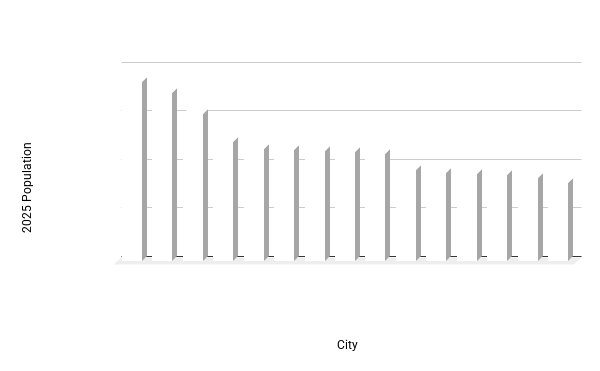
The bar chart of 2025 population clearly shows that Tokyo and Delhi are the largest megacities, while smaller cities like Istanbul have far lower populations, highlighting the huge scale differences among the top 15 cities. The dot plot of population change percentages emphasizes trends in growth, showing that cities in Africa and South Asia, such as Kinshasa and Lagos, are expanding rapidly, while cities like Tokyo and Osaka are slightly shrinking. The pie chart represents each city’s share of the total combined population, revealing that a small number of cities dominate the global urban population. Together, these visualizations provide both absolute and relative perspectives on population size and growth trends, helping identify which cities are major hubs and which are rapidly emerging.